အကူအညီ / အစီရင်ခံစာများ
ဤစာမျက်နှာကို မဘာသာပြန်ရသေးပါ — အင်္ဂလိပ်စာသားကို ပြထားသည်။
ABC analysis of the menu
Which items feed the venue, which hold the middle and which just take up space — by revenue, profit or quantity.
ABC analysis splits the menu into three groups by their contribution to the chosen measure.
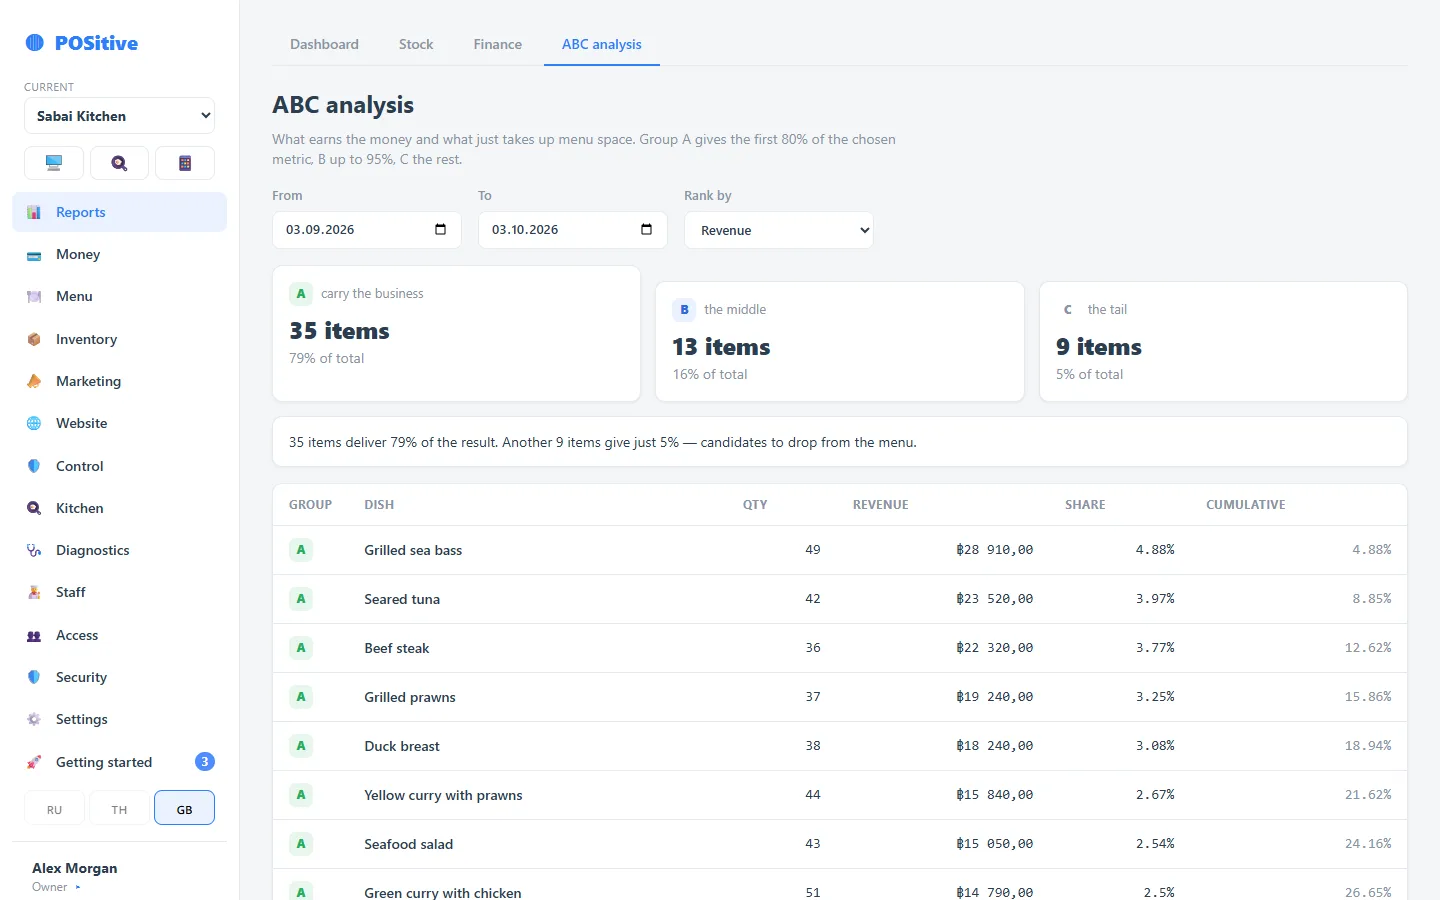
| Group | What it is | Contribution |
|---|---|---|
| A | Feed the venue | The first 80 % of the result |
| B | The middle | Up to 95 % |
| C | The menu tail | The rest |
What to measure by
- by revenue — what brings in money;
- by profit — what brings in money after cost; for a kitchen this is fairer;
- by quantity — what gets ordered most often.
Comparing the first two is the most useful: a dish in group A by revenue and in C by profit is an item that sells a lot and earns little.
What to do with group C
Do not delete automatically. Check first:
- whether the dish is hidden at the end of its category — then the problem is the layout;
- whether the price is too high compared with its neighbours;
- whether you keep it for one regular guest — sometimes that is deliberate.
If none of these — the item takes up space on the menu and in purchasing. It is worth moving it to the archive.
A shorter menu means a faster kitchen
Every item on the menu means ingredients in the fridge, prep and the cook’s attention. Cutting the tail usually speeds up order delivery more noticeably than hiring one more person.